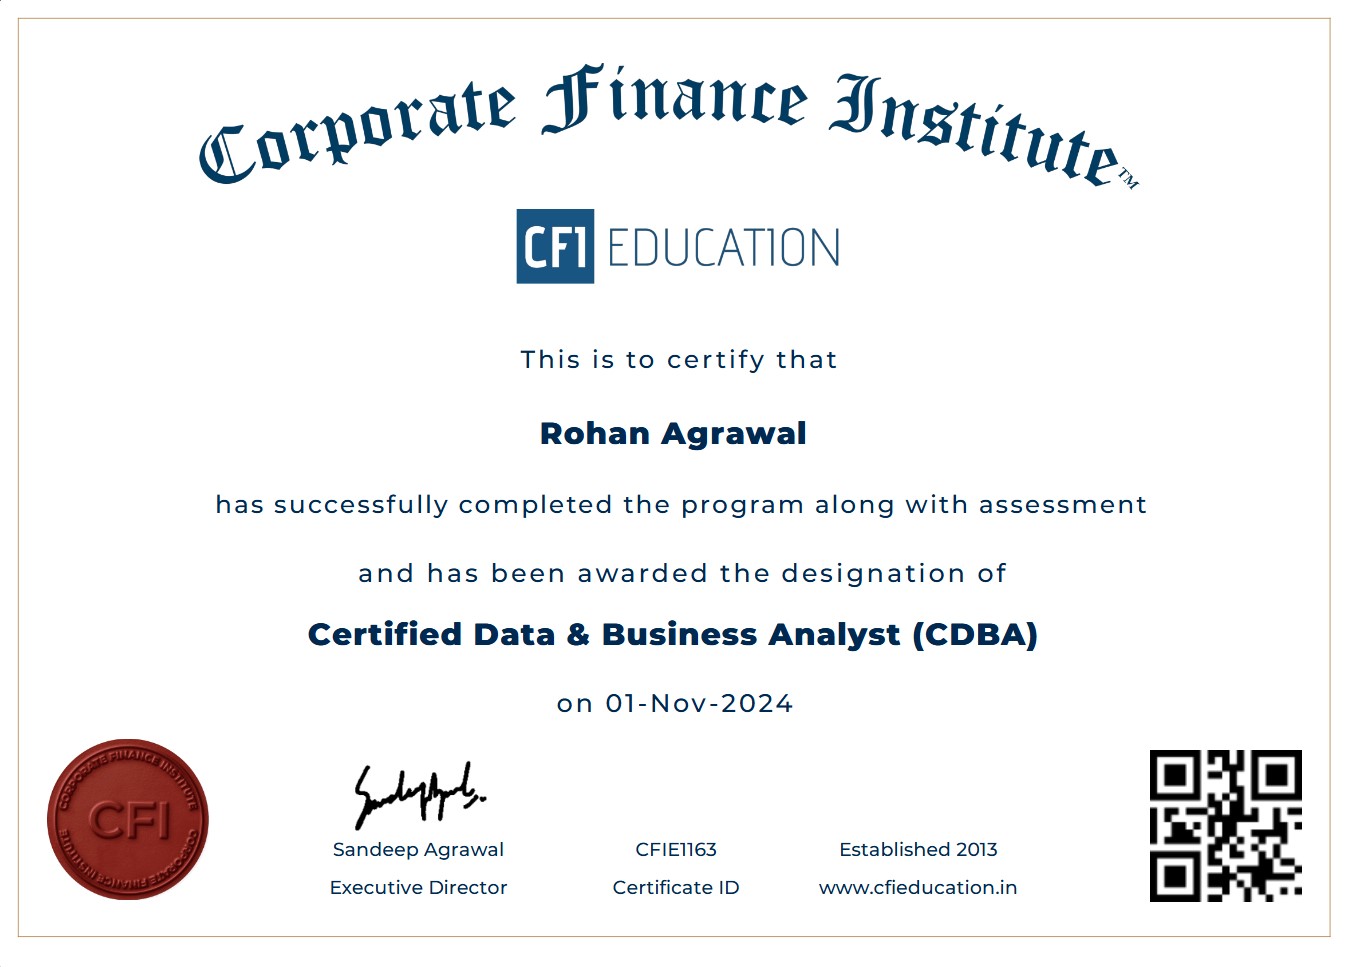
Certified Data & Business Analyst (CDBA) Program
- India's Leading Data Analyst Course for Finance Professionals
- Classroom / Live Online + Self-Paced Program
- Project Work & Certification
- Weekend and Weekday Batches
- Learn From Seasoned Professionals
- Accreditation from IT - ITeS SSC NASSCOM New
CFI – India’s Leading Finance and Analytics Training Institute
CFI’s “Certified Data & Business Analyst (CDBA)” program prepares you to become a Certified Data & Business Analyst CDBA equips you with the skills and insights needed to thrive in today’s data-driven business landscape. This comprehensive program is designed to empower professionals and aspiring analysts with the knowledge and expertise required to extract actionable insights, drive informed decision-making, and propel organizational success.
The Business and Data Analysis Mastery course goes beyond traditional analytics, providing a holistic approach that intertwines business acumen with advanced data techniques. Whether you are an aspiring data analyst eager to enter the field or a seasoned professional looking to upskill, this course is your gateway to mastering the symbiotic relationship between business strategy and data analytics.
Top Hiring Companies












Who Should Enroll?
Our training is open to ambitious candidates who come from a range of backgrounds and will typically be

Graduates / Engineers

Post-Graduates / MBAs

CAs/CFAs or equivalents

Analysts / Executives

Business Decision Makers
Course Format
Duration:
12 - 15 weeks
Format:
Blended learning with a mix of live lectures, hands-on workshops, and real-world case studies
Assessments:
Practical assignments, quizzes, and a final project applying learned concepts to a business scenario.
Technologies / Covered

MS Excel

Power BI

SQL

Python and its libraries

Tableau

Statistics
Key Areas of Learning
Business Strategy Integration
Data Exploration and Visualization
Statistical Analysis for Decision-Making
Data-Driven Decision-Making
CDBA Program Curriculum
- Working with Name Range: –
- What does naming a cell range mean?
- Rules for naming cells and ranges
- Naming cell range(s) in a worksheet
- Navigating through workbooks using named ranges
- Creating named ranges automatically based on cell values
- SUM, SUMIF, SUMIFS
- AVERAGE, AVERAGEIF, AVERAGEIFS
- COUNT, COUNTIF, COUNTA, COUNTBLANK
- MAX, MIN, Vlookup, HLookup
- Understanding References
- Relative References
- Absolute References
- Mixed References
- Utilizing names for writing formulae.
- Filtering and Sorting
- Concept and Implementation
- If Function
- AND, OR Function
- Nested Functions
- Create Conditional Formatting
- Rule 1 to 6
- Simple Dropdown List
- Conditional Dropdown List
- TODAY, NOW
- DAY, MONTH, YEAR
- WEEKDAY
- Creating Pivot Table
- Exploring Table Design Tab
- Slicers
- Creating Chart
- Formatting Chart
Module 1: Understanding Analytics & Business Intelligence (BI) Concept
This module will guide the candidate through the basics of Analytics. Learn about the Data & Analytics
• Data & Analytics
• Introduction to Business Intelligence
• Importance of Business Intelligence
• Overview of Self-Service BI
Module 2: Microsoft Power BI Introduction
• Power BI introduction and Overview
• Power BI Desktop – Installation
• Explain Power BI Desktop
• Power BI Screen Elements and Toolbars
Module 3: Connecting Power BI with Different Data Source
• Connect to CSV files in Power BI
• Connect to Excel in Power BI
• Connect to PDF in Power BI
• Connect to Web Page in Power BI
Module 4: Data Cleaning with Power Query
• Power Query Introduction
• Query Editor interface
• Column Transformations
• Combining Data: Append Query
• Combining Data: Merge Query
• Number, Date and Time Calculations
• Text Transformation
• Sorting & Filters Data
• Splitting & Merging Data
• Transforms Data
• Pivot and Unpivot Data
• Adding Columns
• M Built-in Function
Module 5: Data Modelling in Power BI
• What is a PowerPivot?
• What Is a Data Model?
• What is a Relationship?
• Introduction to DAX
• Detecting and Creating Relationships of Tables
• Understanding the Star Schema
• Creating Calculated Columns
• Creating Tables
• Creating Measure
• Row Context vs Set Context
• Working with DAX Functions
• Getting Data from Related Tables
Module 6: Creating Report & Visualization Type in Power BI
• Create a New Power BI Report
• Report Editor in Power BI
• Add, Rename, Delete & Duplicate Page to Power BI Report
• Save Report in Power BI
• Change how visuals interact in a report
• Open a Power BI in Reading View
• Page Display Setting in Power BI report
• Type of Visualization in Power BI ReportAdding Visuals
(Bar, Column, Line, Area, Ribbon, Pie, Scatter, Tree Map, Waterfall, Combo,
Funnel, KPI, Radial Gauge, Doughnut Chart etc.)
• Data Categories, Geo-Data and Maps
• Creating and Working with Tables and Matrix Views
• Customizing Visuals by Field, Format & Analytic
• Filtering Visual, Page, All Pages
• Using Interactive Slicers – Dropdowns and Searches
• Number, Date, Text Slicers
• Applying Conditional Formats to Visualizations
• Drill Visualizations to see underlying Data
• Date Hierarchies
• Show Values as and Quick Measures
• Custom Visualization in Power BI
• Selection Pane
• Lock Objects
• Adding Graphics
• Bookmarks
• Spotlight
• Report Themes
• Using Security by Creating Role Based Views
• Insight – Explain Increase/Decrease
• Export Power BI Data to CSV
Module 6: Creating a Power BI Dashboard
• Dashboard vs Reports
• Creating a Power BI Dashboard
• Dashboard Tiles in Power BI
• Pin a Tiles to Power BI Dashboard from a report
• Power BI publisher in Excel
• Data alert in Power BI Service
• Add Image, Text box, Video or web code to your dashboard
• Tips for designing a great Power BI Dashboard
• Create Phone View of a Dashboard
• Power BI Q&A
• Quick Insights with Power BI
Module 7: Refreshing Data
• Configure schedule refresh data
• Refresh a dataset created from Power BI Desktop (Local)
• Refresh a dataset created from Power BI Desktop (Cloud)
• Disable privacy setting
Module 1: Introduction to SQL and Relational Databases
• Relational database management systems (RDBMS)
• Comparison of SQL and Excel features and use cases
Module 2: SQL Basics
• SQL syntax, keywords, and conventions
• Data types and operators (arithmetic, comparison, logical)
• SQL constraints (Primary/check/default/null….)
• SELECT statement, projection, and filtering data with WHERE aliases and expressions
• Sorting data with ORDER BY
Module 3: Working with Joins and Unions
• Different types of joins (INNER JOIN, LEFT JOIN, RIGHT JOIN, FULL JOIN, CROSS JOIN) ON,
USING, and NATURAL keyword usage
• UNION and UNION ALL set operations
Module 4: Aggregating Data and Group Functions
• GROUP BY clause and grouping sets
• HAVING clause for filtering aggregated results
• Aggregate functions: SUM, COUNT, AVG, MIN, MAX
Module 5: Advanced SQL Queries
• EXISTS and NOT EXISTS operators
• Window functions: RANK, DENSE_RANK, ROW_NUMBER, NTILE, etc.
• Index in SQL
• Nested Stored procedure
Module 6: SQL for Data Management
• Data Manipulation Language (DML): INSERT, UPDATE, DELETE
• Transactions: BEGIN, COMMIT, ROLLBACK
• Optimization SQL Query
• Procedure/Function
Module 7: SQL for Data Analysis and Reporting
• Pivoting data: transforming rows to columns
• Unpivoting data: transforming columns to rows
• GROUP BY extensions (ROLLUP, CUBE, and GROUPING SETS)
- Discussion on Statistics concepts and theories
- Correlation, Var-Covar, Beta, Regression, Monte Carlo Simulation
DATA ANALYSIS WITH PYTHON
Explore the world of data analysis with Python! Learn to dissect data using multi-dimensional arrays in numpy, harness the power of Data Frames in pandas, leverage the SciPy library for mathematical routines, and delve into machine learning with scikit-learn. This course provides hands-on experience through labs using real Python tools like Jupyter notebook in JupyterLab, making your journey into data
analytics both insightful and practical.MODULE 1
– Introduction
– Datatypes, Variables, and Operators
– String and its Associated Functions
– If-Else StatementMODULE 2
– Regular Expressions
– Looping Statements
– Nested Loop
– Pattern-Based ProblemMODULE 3
– Data Structure in – Python:
– List
– Tuple
– Dictionary
– Functions in Python:
– Recursion
– Functions Return Statement
– Modules in PythonMODULE 4
MODULE 5
– List Comprehension
– File Handling in Python:
– Reading, Writing, and Appending into Files
– Comparing Files
– Classes and Objects
– Inheritance and Polymorphism
– Numpy for Creating Arrays
– Data Analysis Using Pandas
– Matplotlib for Graphical RepresentationDATA ANALYSIS WITH PYTHON
COURSE SYLLABUSMODULE 1
– IMPORTING DATASETS
– Learning Objectives
– Understanding the Domain
– Understanding the Dataset
– Python package for data science
– Importing and Exporting Data in Python
– Basic Insights from DatasetsMODULE 2
CLEANING AND PREPARING THE DATA
– Identify and Handle Missing Values
– Data Formatting
– Data NormalizationMODULE 3
MODULE 4
SUMMARIZING THE DATA FRAME
– Descriptive Statistics
– Basics of Grouping
– ANOVA
– Correlation
– More on Correlation
MODEL DEVELOPMENT
– Simple and Multiple Linear Regression Model
– Evaluation Using Visualization
– Polynomial Regression and Pipelines
– R-squared
– MSE for In-Sample Evaluation
– Prediction and Decision Making
MODULE 5
MODEL EVALUATION
– Model Evaluation
– Over-fitting
– Under-fitting
– Model Selection
– Ridge Regression
– Grid SearchD A T A V I S U A L I Z A T I O N W I T H P Y T H O N
COURSE SYLLABUS
MODULE 1
INTRODUCTION TO VISUALIZATION TOOLS**
– Introduction to Data Visualization
– Introduction to Matplotlib
– Basic Plotting with Matplotlib Line PlotsMODULE 2
MODULE 3
BASIC VISUALIZATION TOOLS
– Area Plots
– Histograms
– Bar Charts
SPECIALIZED VISUALIZATION TOOLS
– Pie Charts
– Box Plots
– Scatter Plots
– Bubble Plots- MODULE 4
ADVANCED VISUALIZATION TOOLS
– Waffle Charts
– Word Clouds
– Seaborn and Regression Plots
– Soft Skills Training
– Linkedin Profile Update
– CV Samples to follow.
– Mock Interviews
Upcoming Batch Details
| Weekends (Saturday and Sunday) |
|
| Batch Start Date | 12th Jan 2025 |
| Delivery Type | Classroom & Live Online |

Why CFI Education

Case Study Approach
Real life cases for most effective and skill based learning.

Passionate Educators
Highly experienced instructors who bring real business problems to the classroom.

Individual Attention
Focus on building technical expertise and ensure the learning of all candidates.

Capstone Projects
A month long project work post classroom sessions to gain confidence in their domain area.

Soft Skill Development
Helps candidates in understanding best practices and soft skills development for cracking interviews.

100% Placement Assistance
Have a dedicated team of placement who work towards, CV building and scheduling interviews.
After completing CDBA course, students will be able to pursue diverse and rewarding career paths across various industries including:

1. Data Analyst:

2. Business Analyst:

3. Business Intelligence Analyst:

4. Data Scientist:

5. Market Research Analyst:

6. Operations Analyst:

7. Financial Analyst:

8. Consultant:

9. Entrepreneur or Business Owner:
Success Stories

Students Speak


